From Tokens to Tables: How NLP Tech is Revolutionizing Synthetic Datasets

cover
8 Apr 2025
  1. Abstract & Introduction

  2. Proposal

    1. Classification Target
    2. Masked Conditional Density Estimation (MaCoDE)
  3. Theoretical Results

    1. With Missing Data
  4. Experiments

  5. Results

    1. Related Works
    2. Conclusions and Limitations
    3. References
  6. A1 Proof of Theorem 1

    1. A2 Proof of Proposition 1
    2. A3 Dataset Descriptions
  7. A4 Missing Mechanism

    1. A5 Experimental Settings for Reproduction
  8. A6 Additional Experiments

  9. A7 Detailed Experimental Results

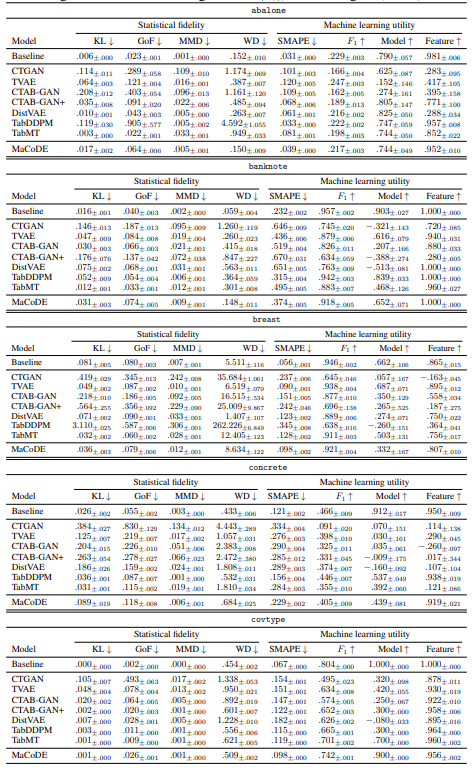
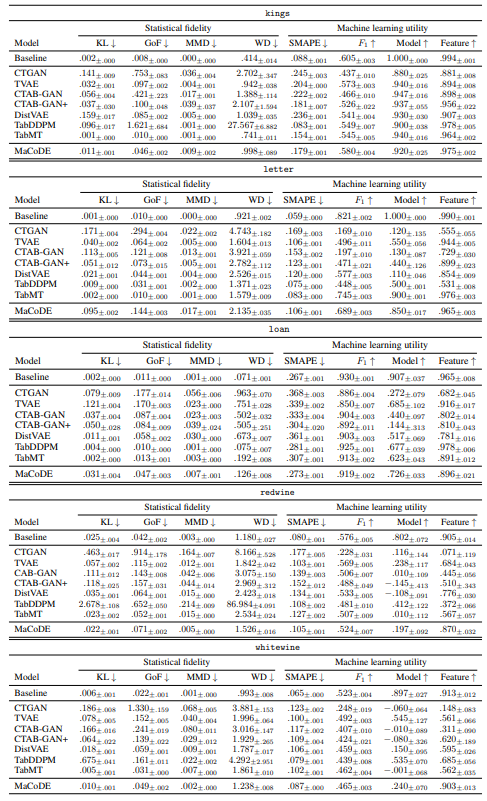
A.7 Detailed Experimental Results

A.7.1 Q1. Synthetic Data Quality

Table 11: Q1: Statistical fidelity and machine learning utility for each dataset. The means and the standard errors of the mean across 10 repeated experiments are reported. ‘Baseline’ refers to the result obtained using half of the real training dataset. ↑ (↓) denotes higher (lower) is better.

Table 11: Q1: Statistical fidelity and machine learning utility for each dataset. The means and the standard errors of the mean across 10 repeated experiments are reported. ‘Baseline’ refers to the result obtained using half of the real training dataset. ↑ (↓) denotes higher (lower) is better.

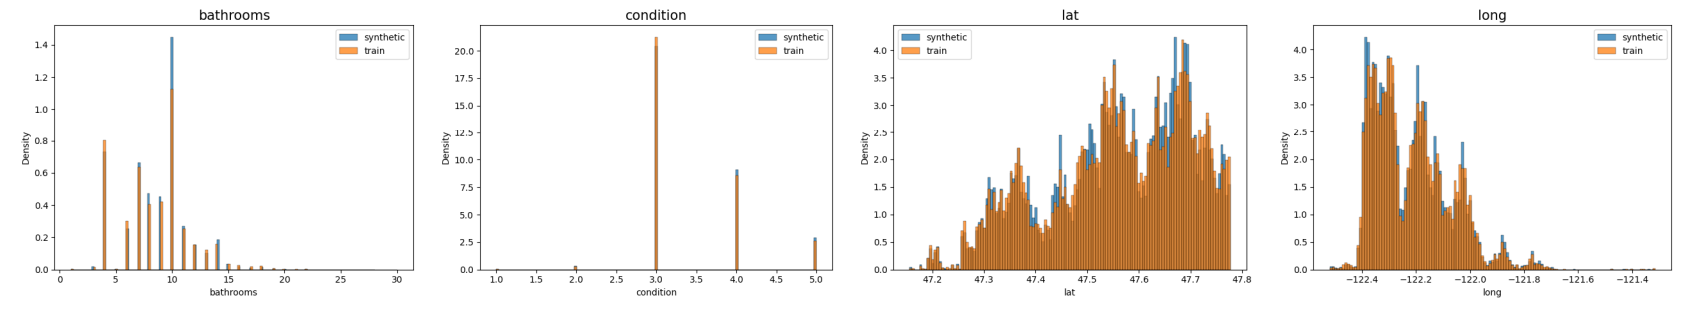
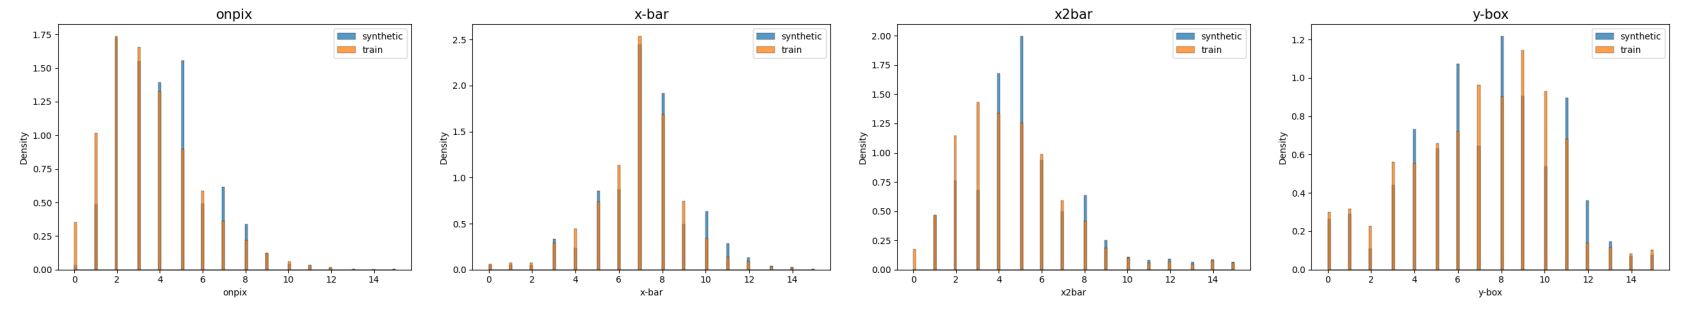
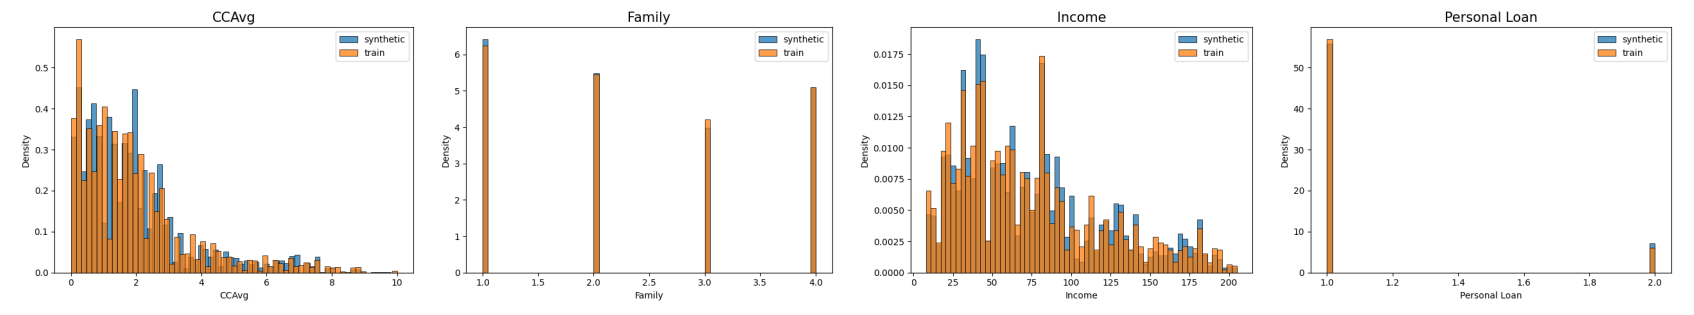
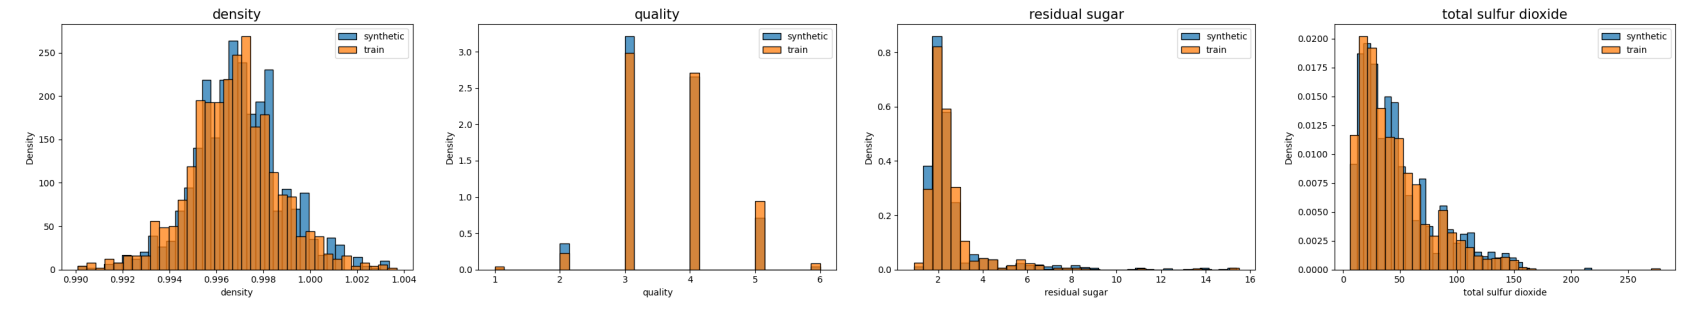
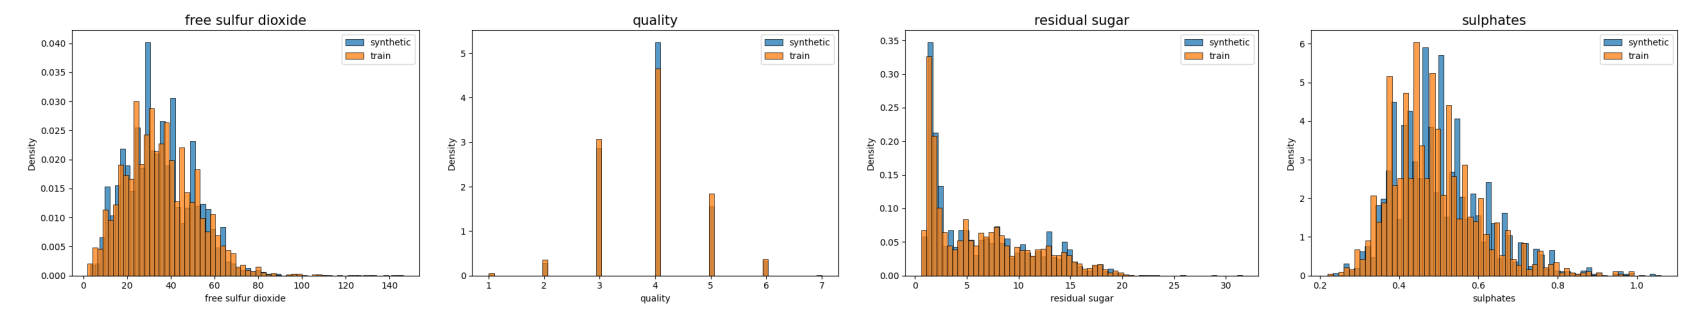
A.7.2 Q1. Visualization of Marginal Histogram

Figure 7: Histograms of observed dataset and synthetic dataset, generated by MaCoDE.

(a) abalone

(b) banknote

(c) breast

(d) concreate

(e) covtype

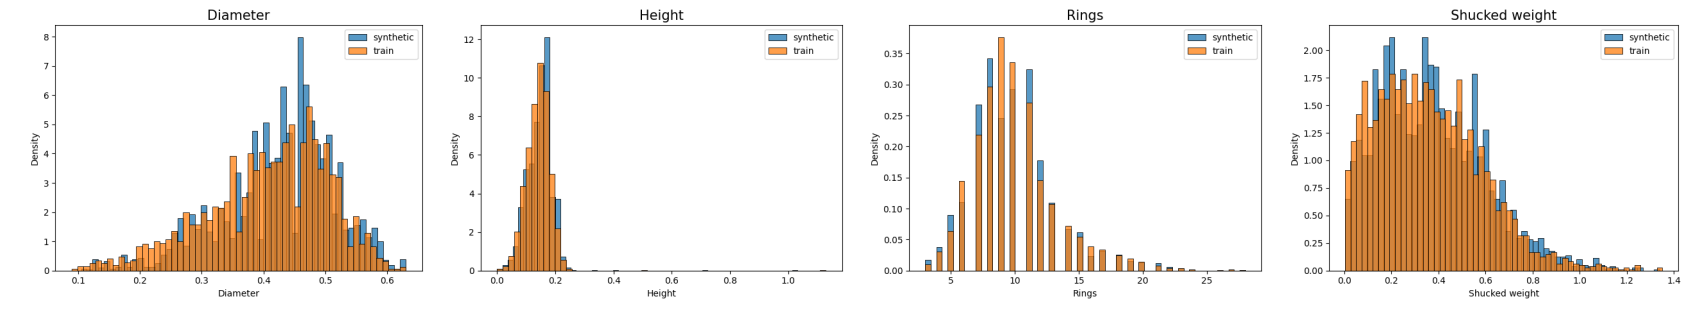
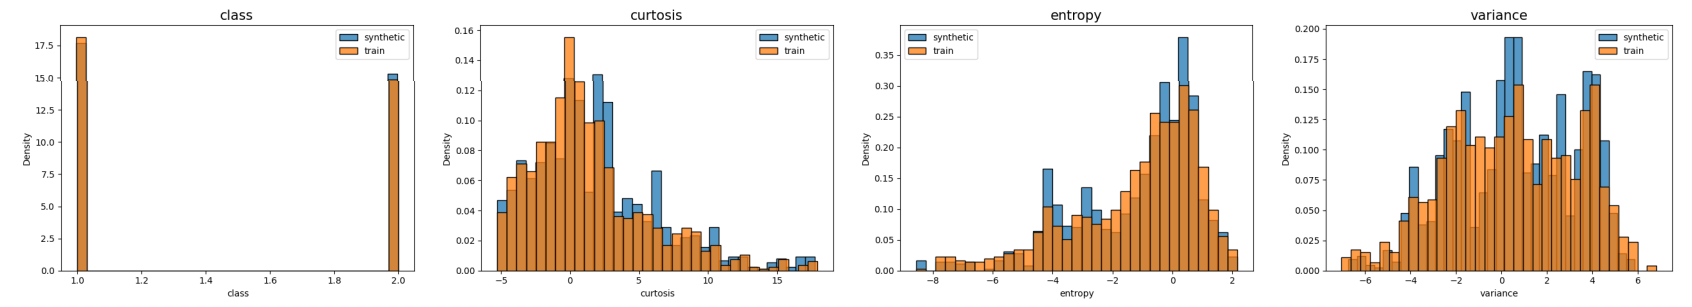
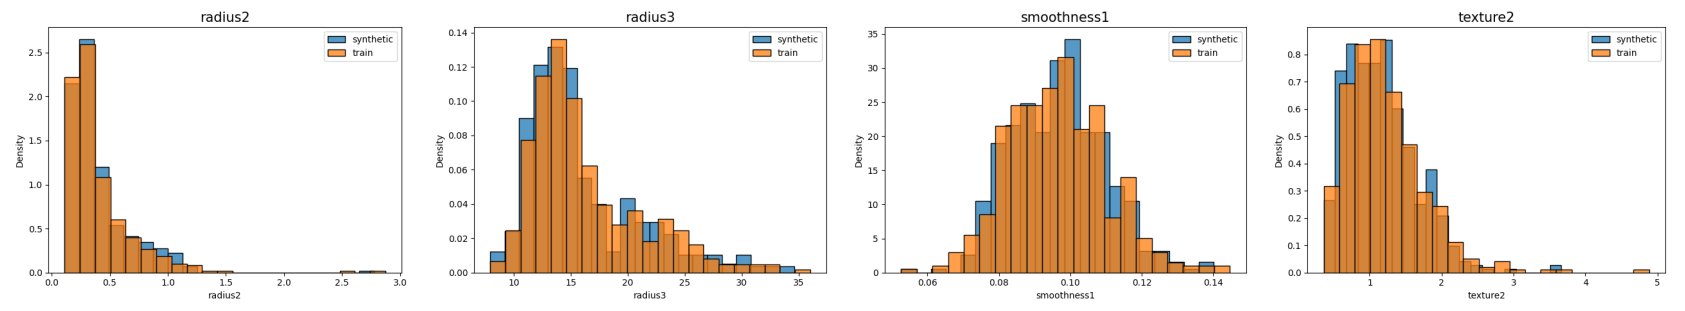
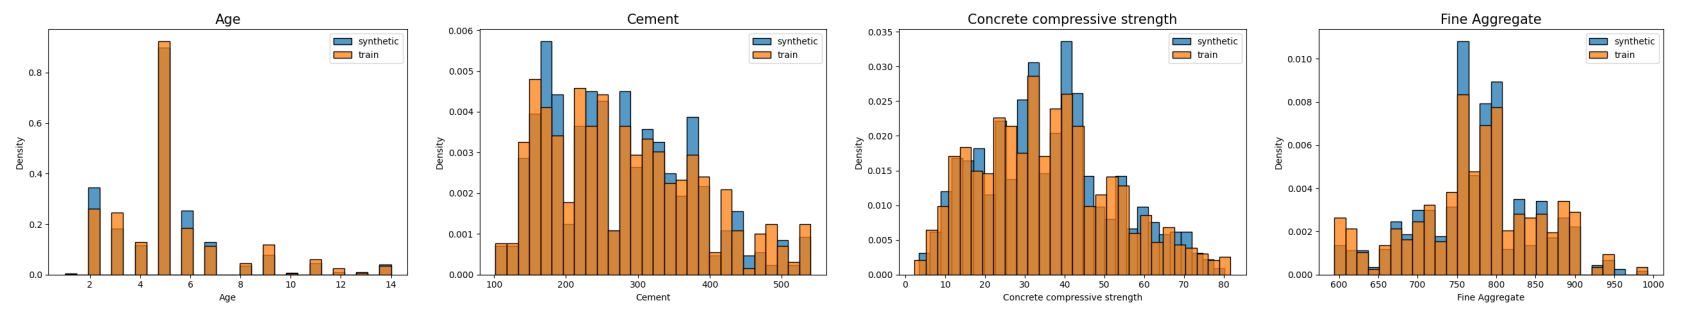
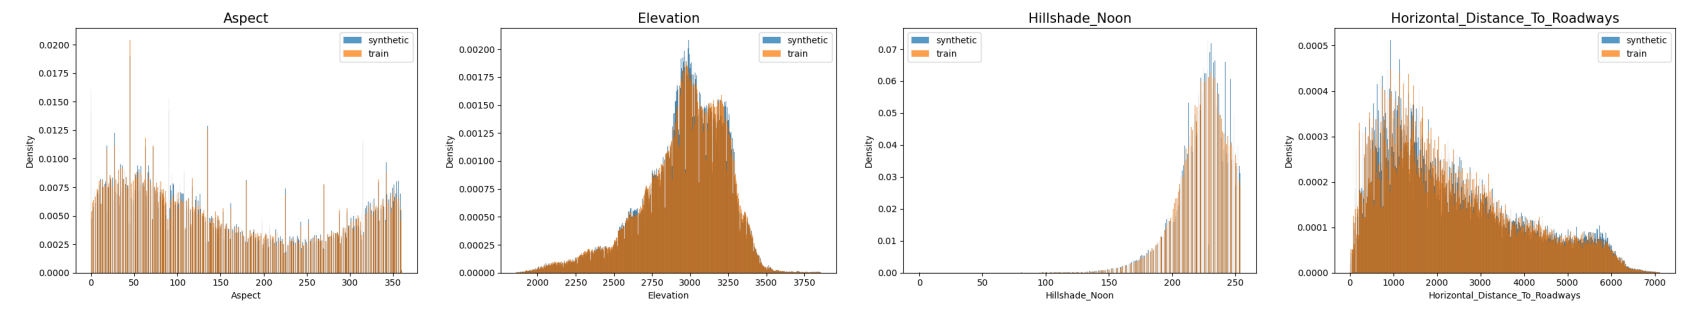
Figure 8: Histograms of observed dataset and synthetic dataset, generated by MaCoDE.

(a) kings

(b) letter

(c) loan

(d) redwine

(e) whitewine

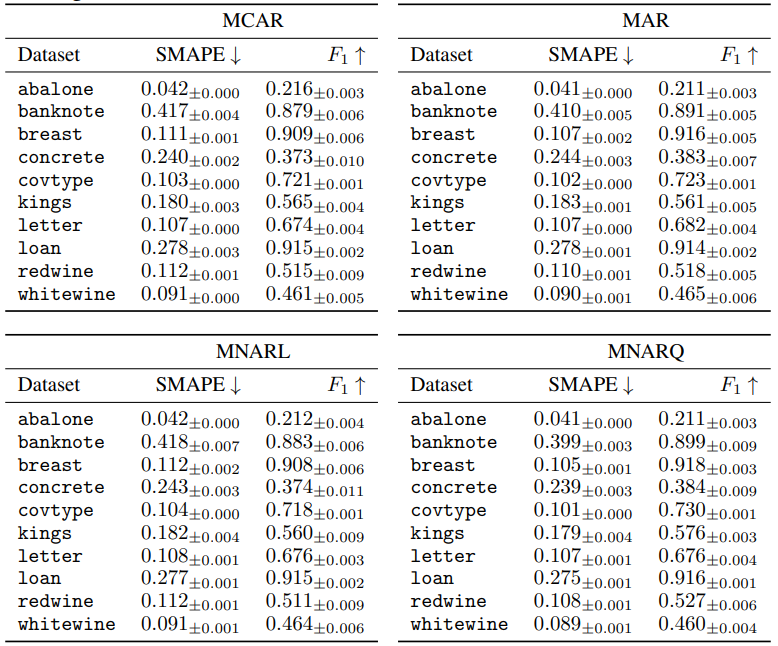
A.7.3 Q2: Synthetic Data Quality in Scenarios with Incomplete Training Dataset

Table 12: Q2: Machine learning utility for each dataset under MCAR, MAR, MNARL, and MNARQ at 0.3 missingness. The means and standard errors of the mean 10 repeated experiments are reported. ↑ (↓) denotes higher (lower) is better.

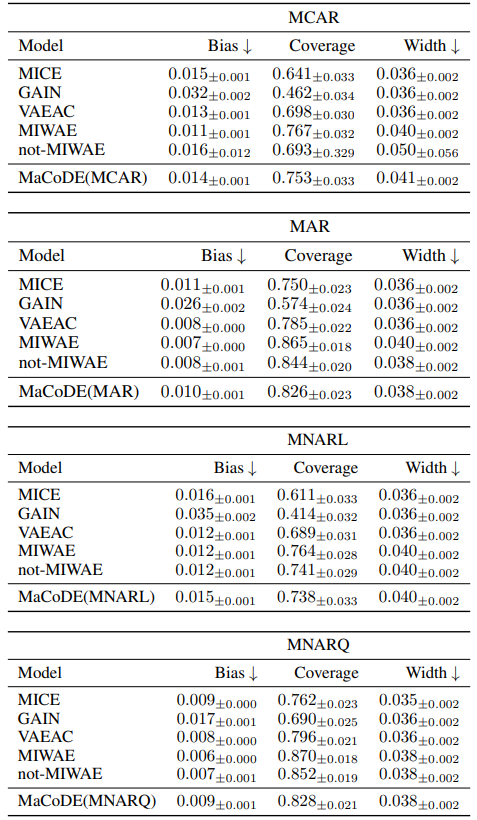
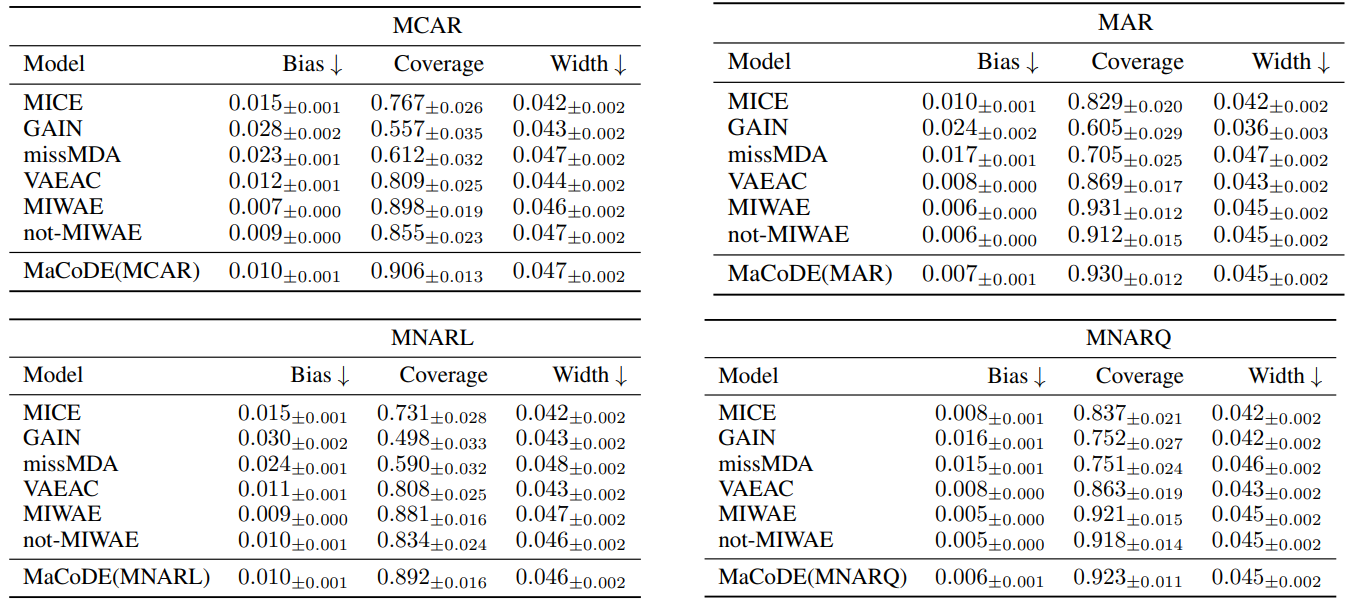
A.7.4 Q3: Multiple Imputation Performance

Table 13: Q3: Multiple imputation under MCAR, MAR, MNARL, and MNARQ at 0.3 missingness. The means and standard errors of the mean across 10 datasets and 10 repeated experiments are reported. ↓ denotes the lower is better.

Table 14: Q3: Multiple imputation for each dataset under MCAR at 0.3 missingness. The means and standard errors of the mean across 10 repeated experiments are reported. Due to computational issues, the number of multiple imputations is set to 10 for the covtype dataset, while for other datasets it is set to 100. ↓ denotes lower is better.

Table 15: Q3: Multiple imputation for each dataset under MAR at 0.3 missingness. The means and standard errors of the mean across 10 repeated experiments are reported. Due to computational issues, the number of multiple imputations is set to 10 for the covtype dataset, while for other datasets it is set to 100. ↓ denotes lower is better.

Table 16: Q3: Multiple imputation for each dataset under MNARL at 0.3 missingness. The means and standard errors of the mean across 10 repeated experiments are reported. Due to computational issues, the number of multiple imputations is set to 10 for the covtype dataset, while for other datasets it is set to 100. ↓ denotes lower is better.

Table 17: Q3: Multiple imputation for each dataset under MNARQ at 0.3 missingness. The means and standard errors of the mean across 10 repeated experiments are reported. Due to computational issues, the number of multiple imputations is set to 10 for the covtype dataset, while for other datasets it is set to 100. ↓ denotes lower is better.

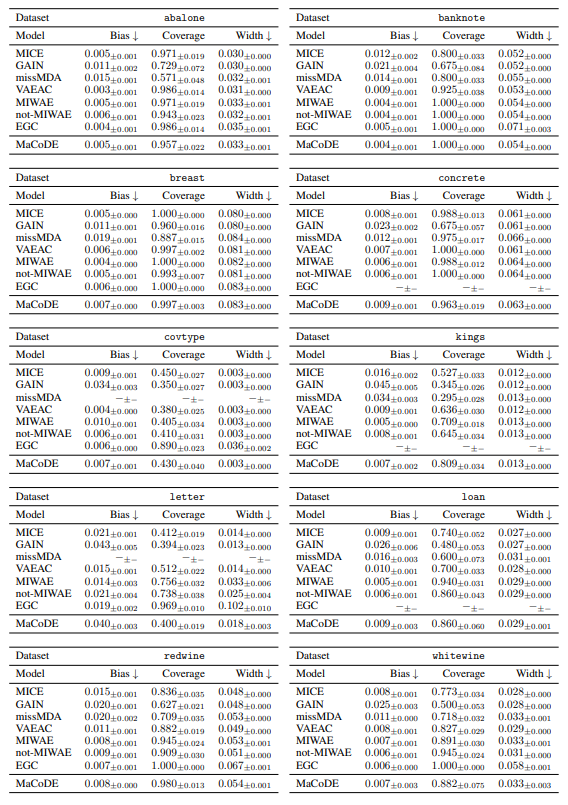
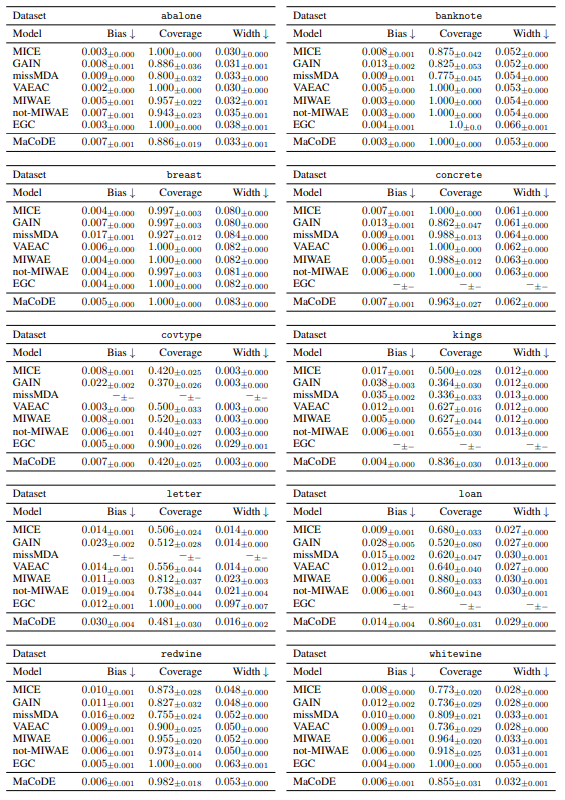
A.7.5 Q3: Multiple Imputation Performance of missMDA

Table 18: missMDA. Q3: Multiple imputation under MCAR, MAR, MNARL, and MNARQ at 0.3 missingness. The means and standard errors of the mean across 8 out of 10 datasets, except for covtype and letter, and 10 repeated experiments are reported. ↓ denotes lower is better.

A.7.6 Q3: Multiple Imputation Performance of EGC

Table 19: EGC. Q3: Multiple imputation under MCAR, MAR, MNARL, and MNARQ at 0.3 missingness. The means and standard errors of the mean across 7 out of 10 datasets, except for concrete, kings, and loan, and 10 repeated experiments are reported. ↓ denotes lower is better.

Authors:

(1) Seunghwan An, Department of Statistical Data Science, University of Seoul, S. Korea (dkstmdghks79@uos.ac.kr);

(2) Gyeongdong Woo, Department of Statistical Data Science, University of Seoul, S. Korea (dngudxor23@uos.ac.kr);

(3) Jaesung Lim, Department of Statistical Data Science, University of Seoul, S. Korea (wotjd1410@uos.ac.kr);

(4) ChangHyun Kim, Department of Statistical Data Science, University of Seoul, S. Korea (hahaha503@uos.ac.kr);

(5) Sungchul Hong, Department of Statistics, University of Seoul, S. Korea (shong@uos.ac.kr);

(6) Jong-June Jeon (corresponding author), Department of Statistics, University of Seoul, S. Korea (jj.jeon@uos.ac.kr).


This paper is available on arxiv under CC BY-NC-SA 4.0 DEED license.